Dee’s Bicycle Ride day #31a
Leave a reply
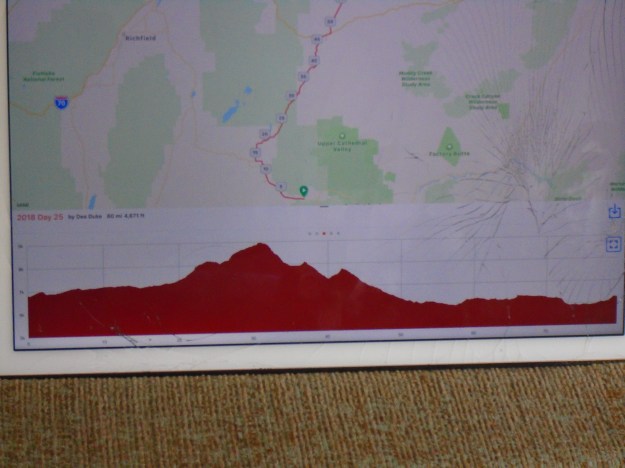 I have an app on my IPad that I use to plot and plan each days ride. Once it is all done and downloaded it produces an “Elevation Profile” that gives you a picture of the day in terms of elevation. The elevation heights are labeled on the side, though you probably can’t see those, but from that you can figure the climbing you will be doing the next day. It also has color coding on it that you can’t see either, which indicates the percent of grade. Anything marked “red” means bad news, 10 % or more, anything marked blue is 8% to 10% grade, and anything marked in green means 2% to 6% grade, and tan is under 2%. I down load it on my phone as well, and all during the day there is a blue dot on the profile and the route that tells me where I am so I can breath easy or start to sweat based on what is ahead. I have often thought about “chucking” the app and just being surprised by what the next day brings in way of challenges. The problem with knowing what is coming the next day is that it produces an anxiety about how hard it will be, and if I can do it.